This feature is is only available on the Production and Enterprise plans.
Key Benefits of Horizontal Autoscaling
- Cost efficiency & Performance: Ensure your App Services are always using the optimal amount of containers. Scale loads with periods of high and low usage that can be parallelized - efficiently.
- Greater reliability: Reduce the likelihood of an expensive computation (ie. a web request) consuming all of your fixed size processing capability
- Reduced engineering time: Save time manually scaling your app services with greater automation
What App Services are good candidates for HAS?
First, let’s consider what sort of process is NOT a candidate:- Job workers, unless your jobs are idempotent and/or your queue follows exactly-once semantics
- Services that cannot be easily parallelized
- If your workload is not easily parallelized, you could end up in a scenario where all the load is on one container and the others do near-zero work.
So what’s a good candidate?
- Services that have predictable and well-understood load patterns
- We talk about this more in How to determine the right Horizontal Autoscaling configuration for your App Services
- Services that have a workload that can be easily parallelized
- Web workers as an example, since each web request is completely independent from another
- Services that experience periods of high/low load
- However, there’s no real risk to setting up HAS on any service just in case they ever experience higher load than expected, as long as having multiple processes running at the same time is not a problem (see above for processed that are not candidates).
How to determine the right Horizontal Autoscaling configuration for your App Services
Horizontal Autoscaling is configured per App Service. Guidelines to keep in mind for configuration:- Minimum number of containers - Should be set to 2 as a minimum if you want High-Availability
- Max number of containers - This one depends on how many requests you want to be able to handle under load, and will differ due to specifics of how your app behaves. If you’ve done load testing with your app and understand how many requests your app can handle with the container size you’re currently using, it is a matter of calculating how many more containers you’d want.
- Min CPU threshold - You should set this to slightly above the CPU usage your app exhibits when there’s no/minimal usage to ensure scale downs happen, any lower and your app will never scale down. If you want scale downs to happen faster, you can set this threshold higher.
- Max CPU threshold - A good rule of thumb is 80-90%. There is some lead time to scale ups occurring, as we need a minimum amount of metrics to have been gathered before the next scale-up event happens, so setting this close to 100% can lead to bottlenecks. If you want scale ups to happen faster, you can set this threshold lower.
- Scale Up, and Scale Down Steps - These are set to 1 by default, but you are able to modify the values if you want autoscaling events to jump up or down by more than 1 container at a time.
Percentile + Scale Up / Down Thresholds (CPU Usage)
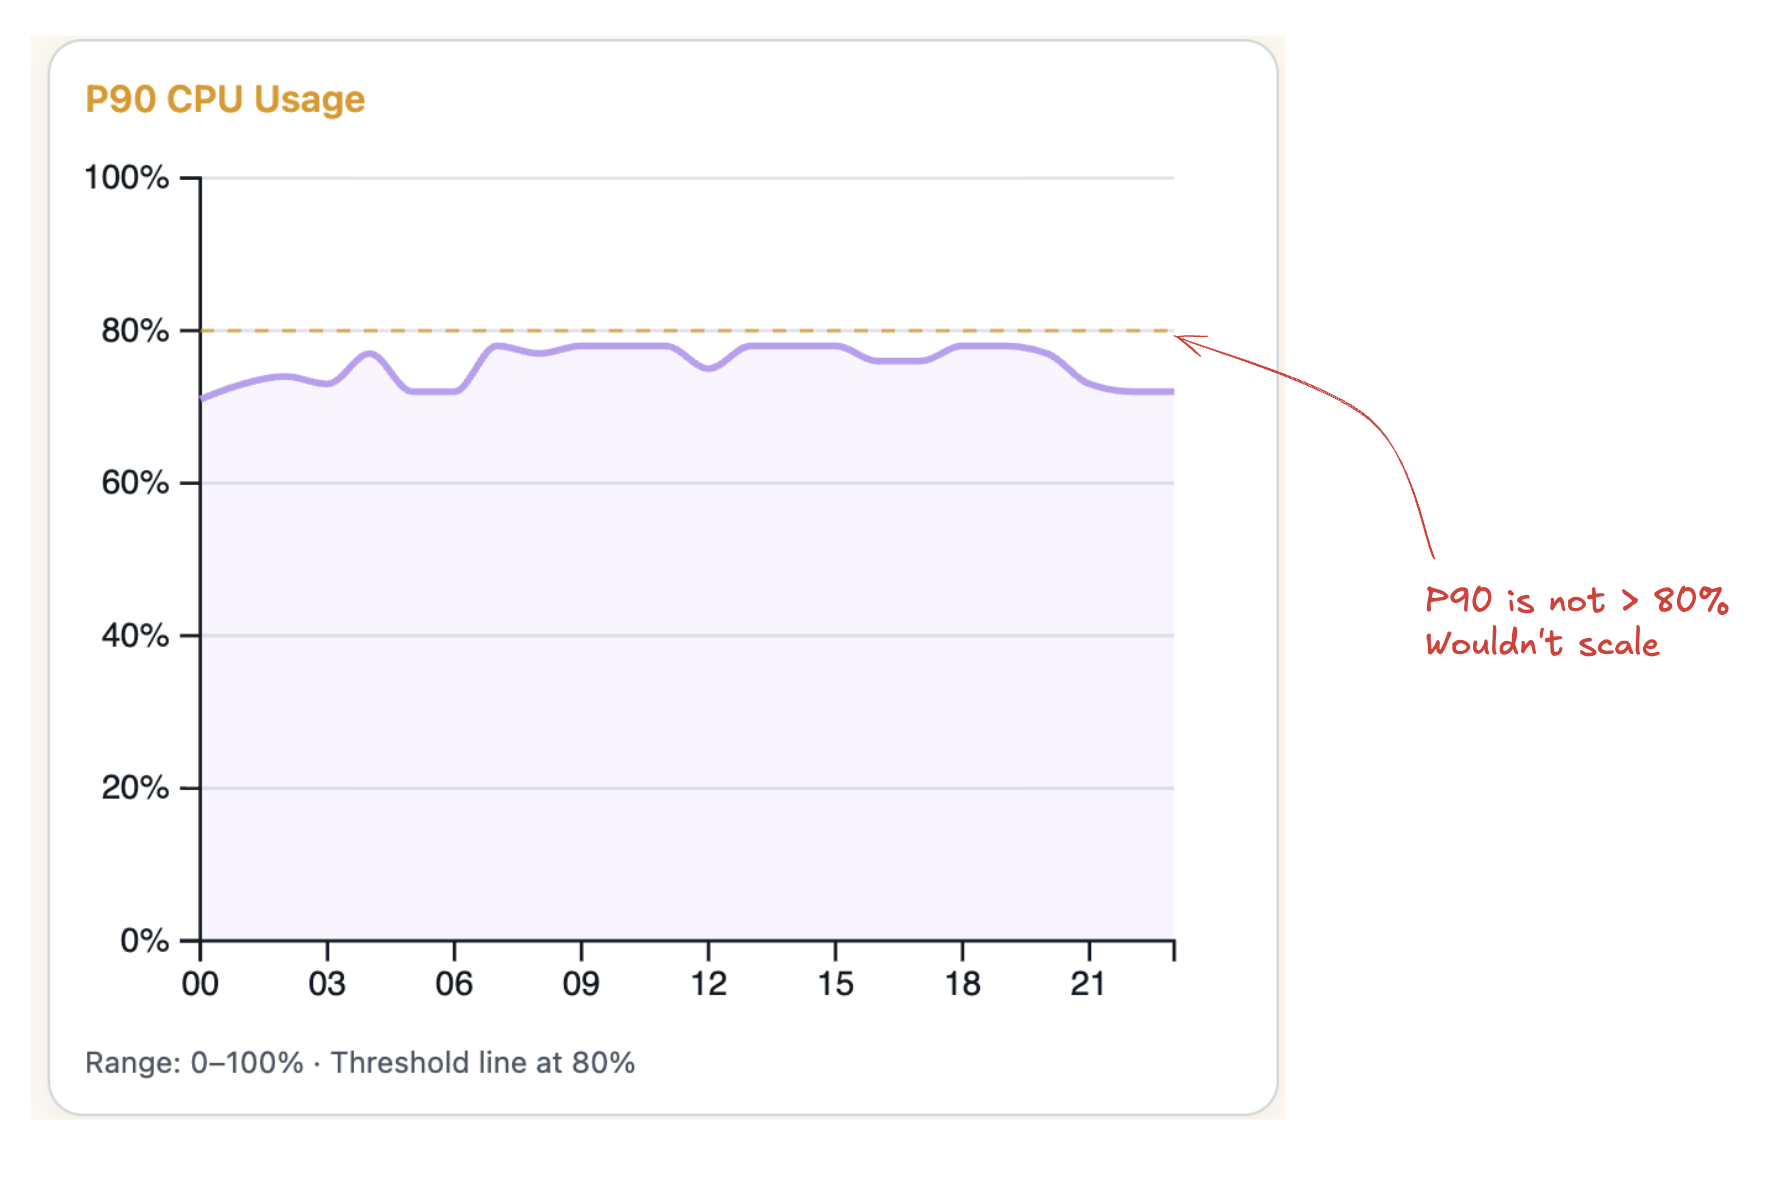
Percentiles decide how aggressively the autoscaler reacts to spikes in CPU usage. For example:- P90: Ignores the top 10% of CPU spikes. This ensures that application performance is mostly within the desired range by focusing on general performance trends.
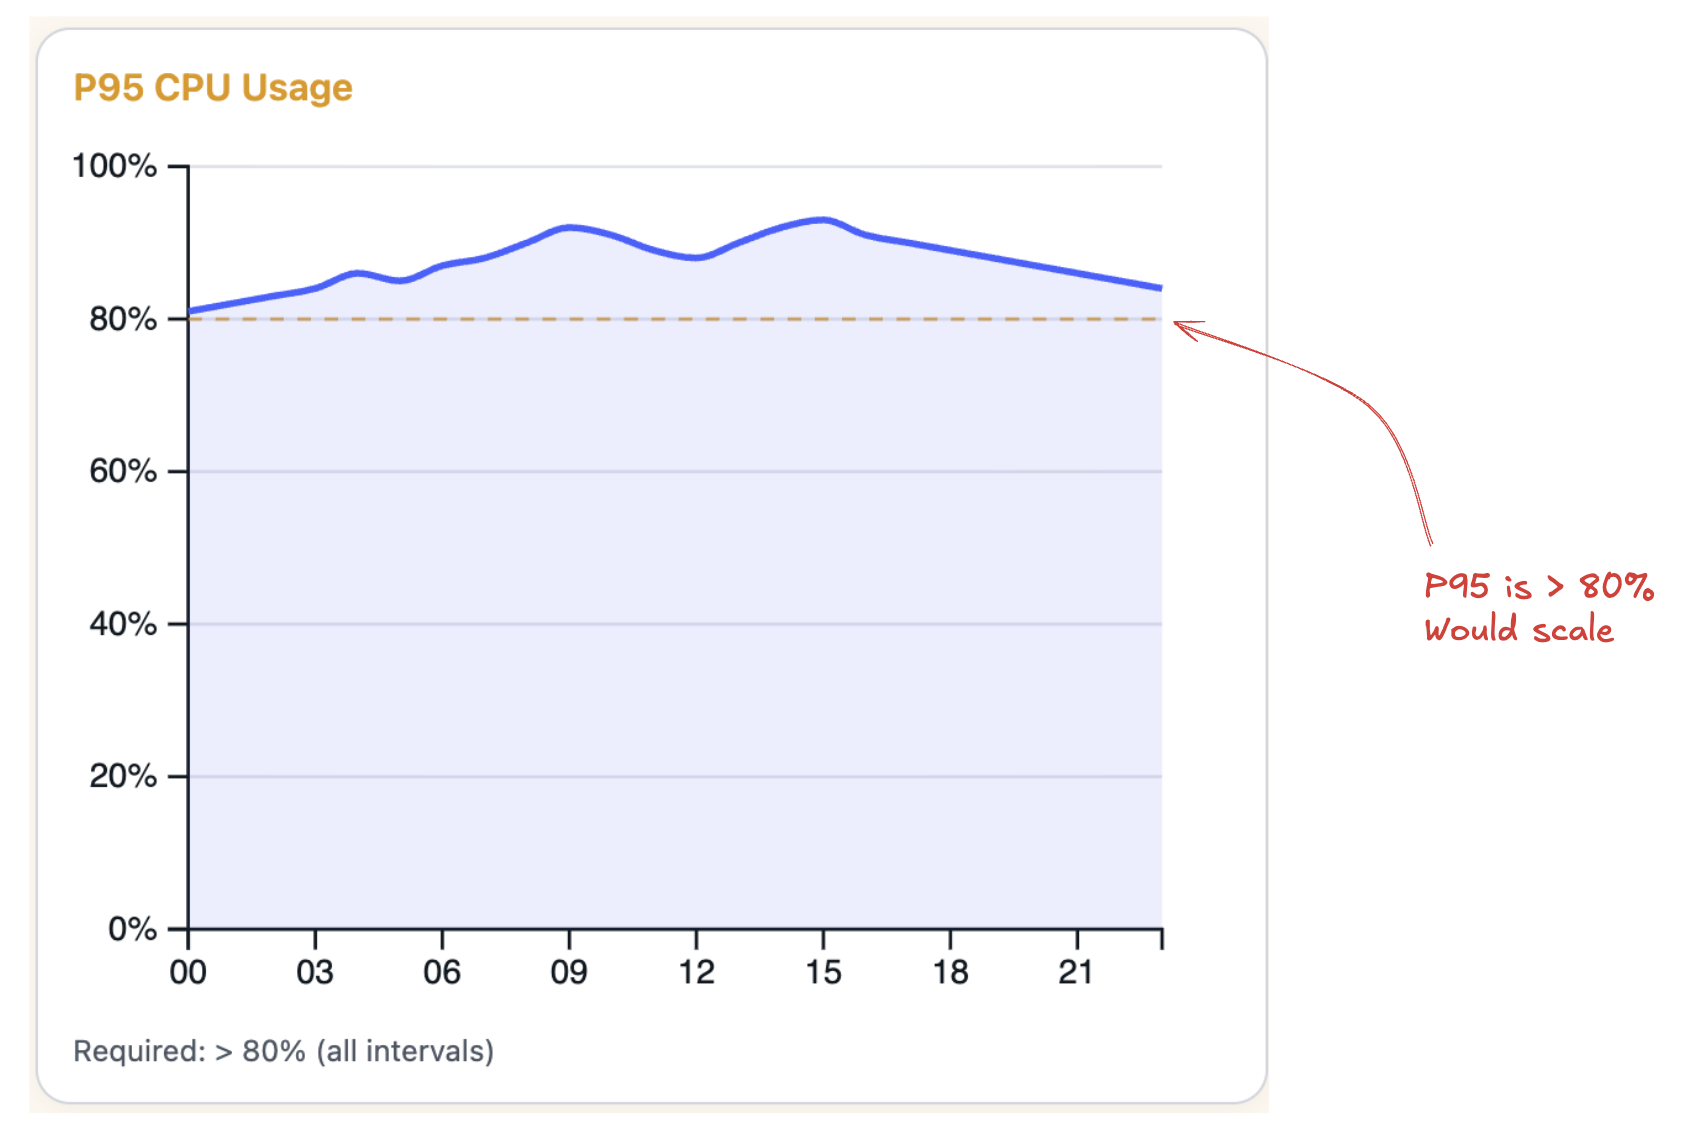
- P95: Ignores the top 5% of CPU spikes. This ensures better overall performance, but will also result in more scaling activity.
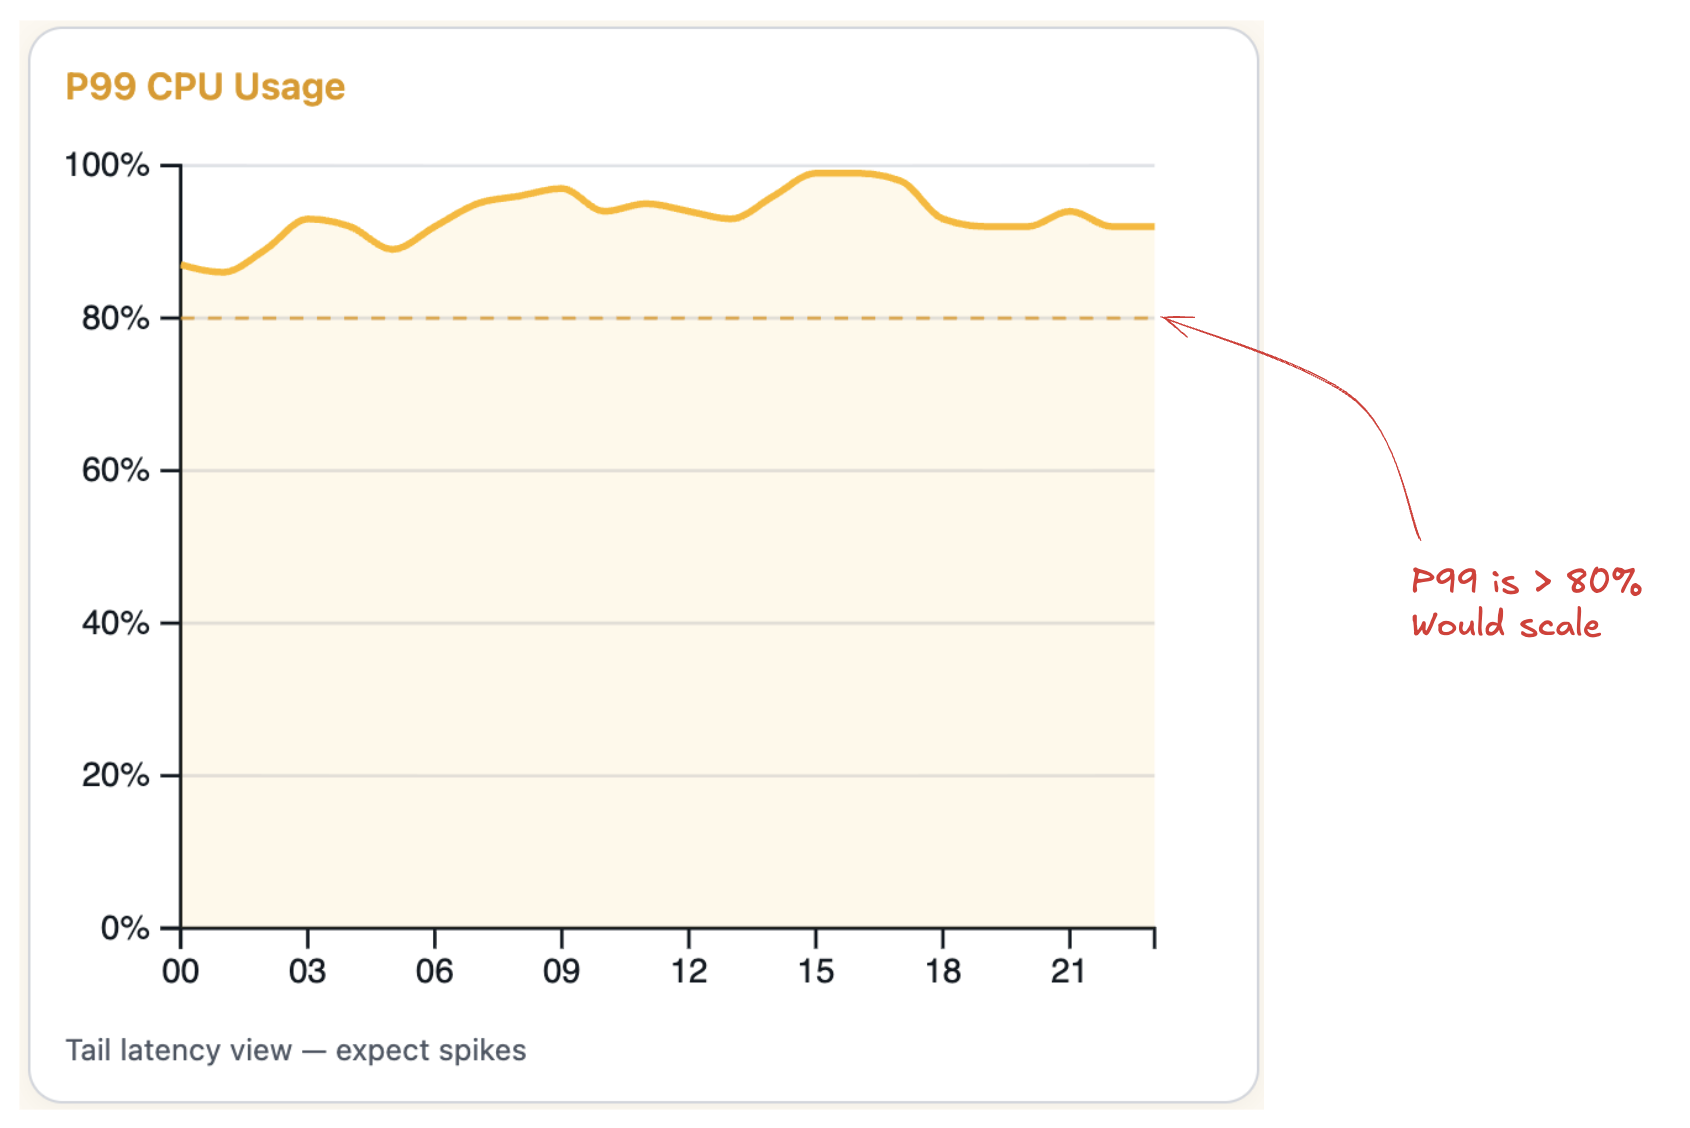
- P99: Ignores the top 1% of CPU spikes. This results in the most scaling activity, but also the best performance.
Scale Up/Down Cooldowns
Cooldowns add deliberate pauses between scaling events to give your app time to stabilize and to prevent rapid repeated scaling events. In the example below, we wouldn’t scale up during the Scale Up Cooldown, even though CPU usage remains consistently over the Scale Up Threshold of 80%.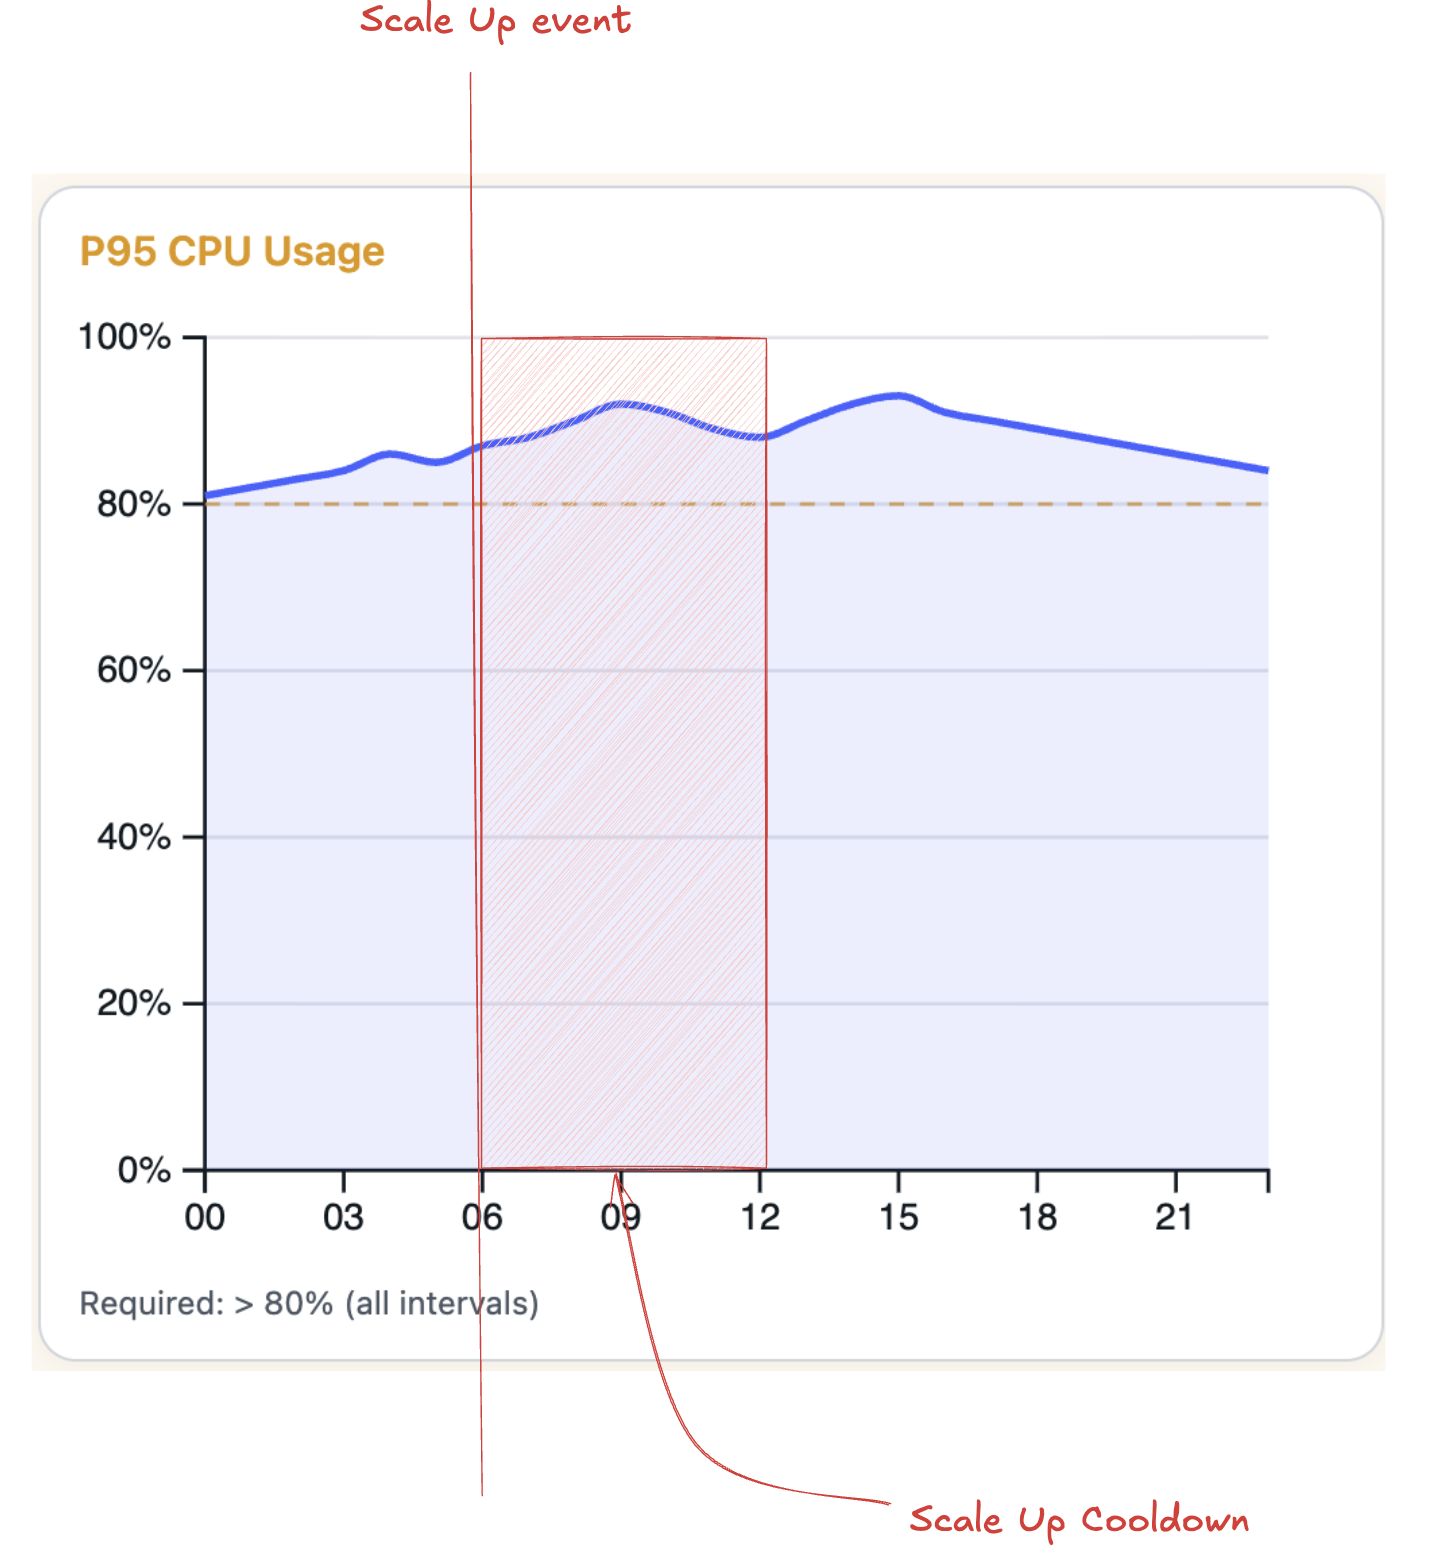
Post Release Cooldown
After a deployment, Aptible discards metrics within this interval to allow for service stabilization. In the example below, we would not scale up even though usage is over the 80% Scale Up Threshold for most of the Metric Lookback Time Interval. This is because the data within the Post Release Cooldown window is not included when evaluating whether or not to autoscale.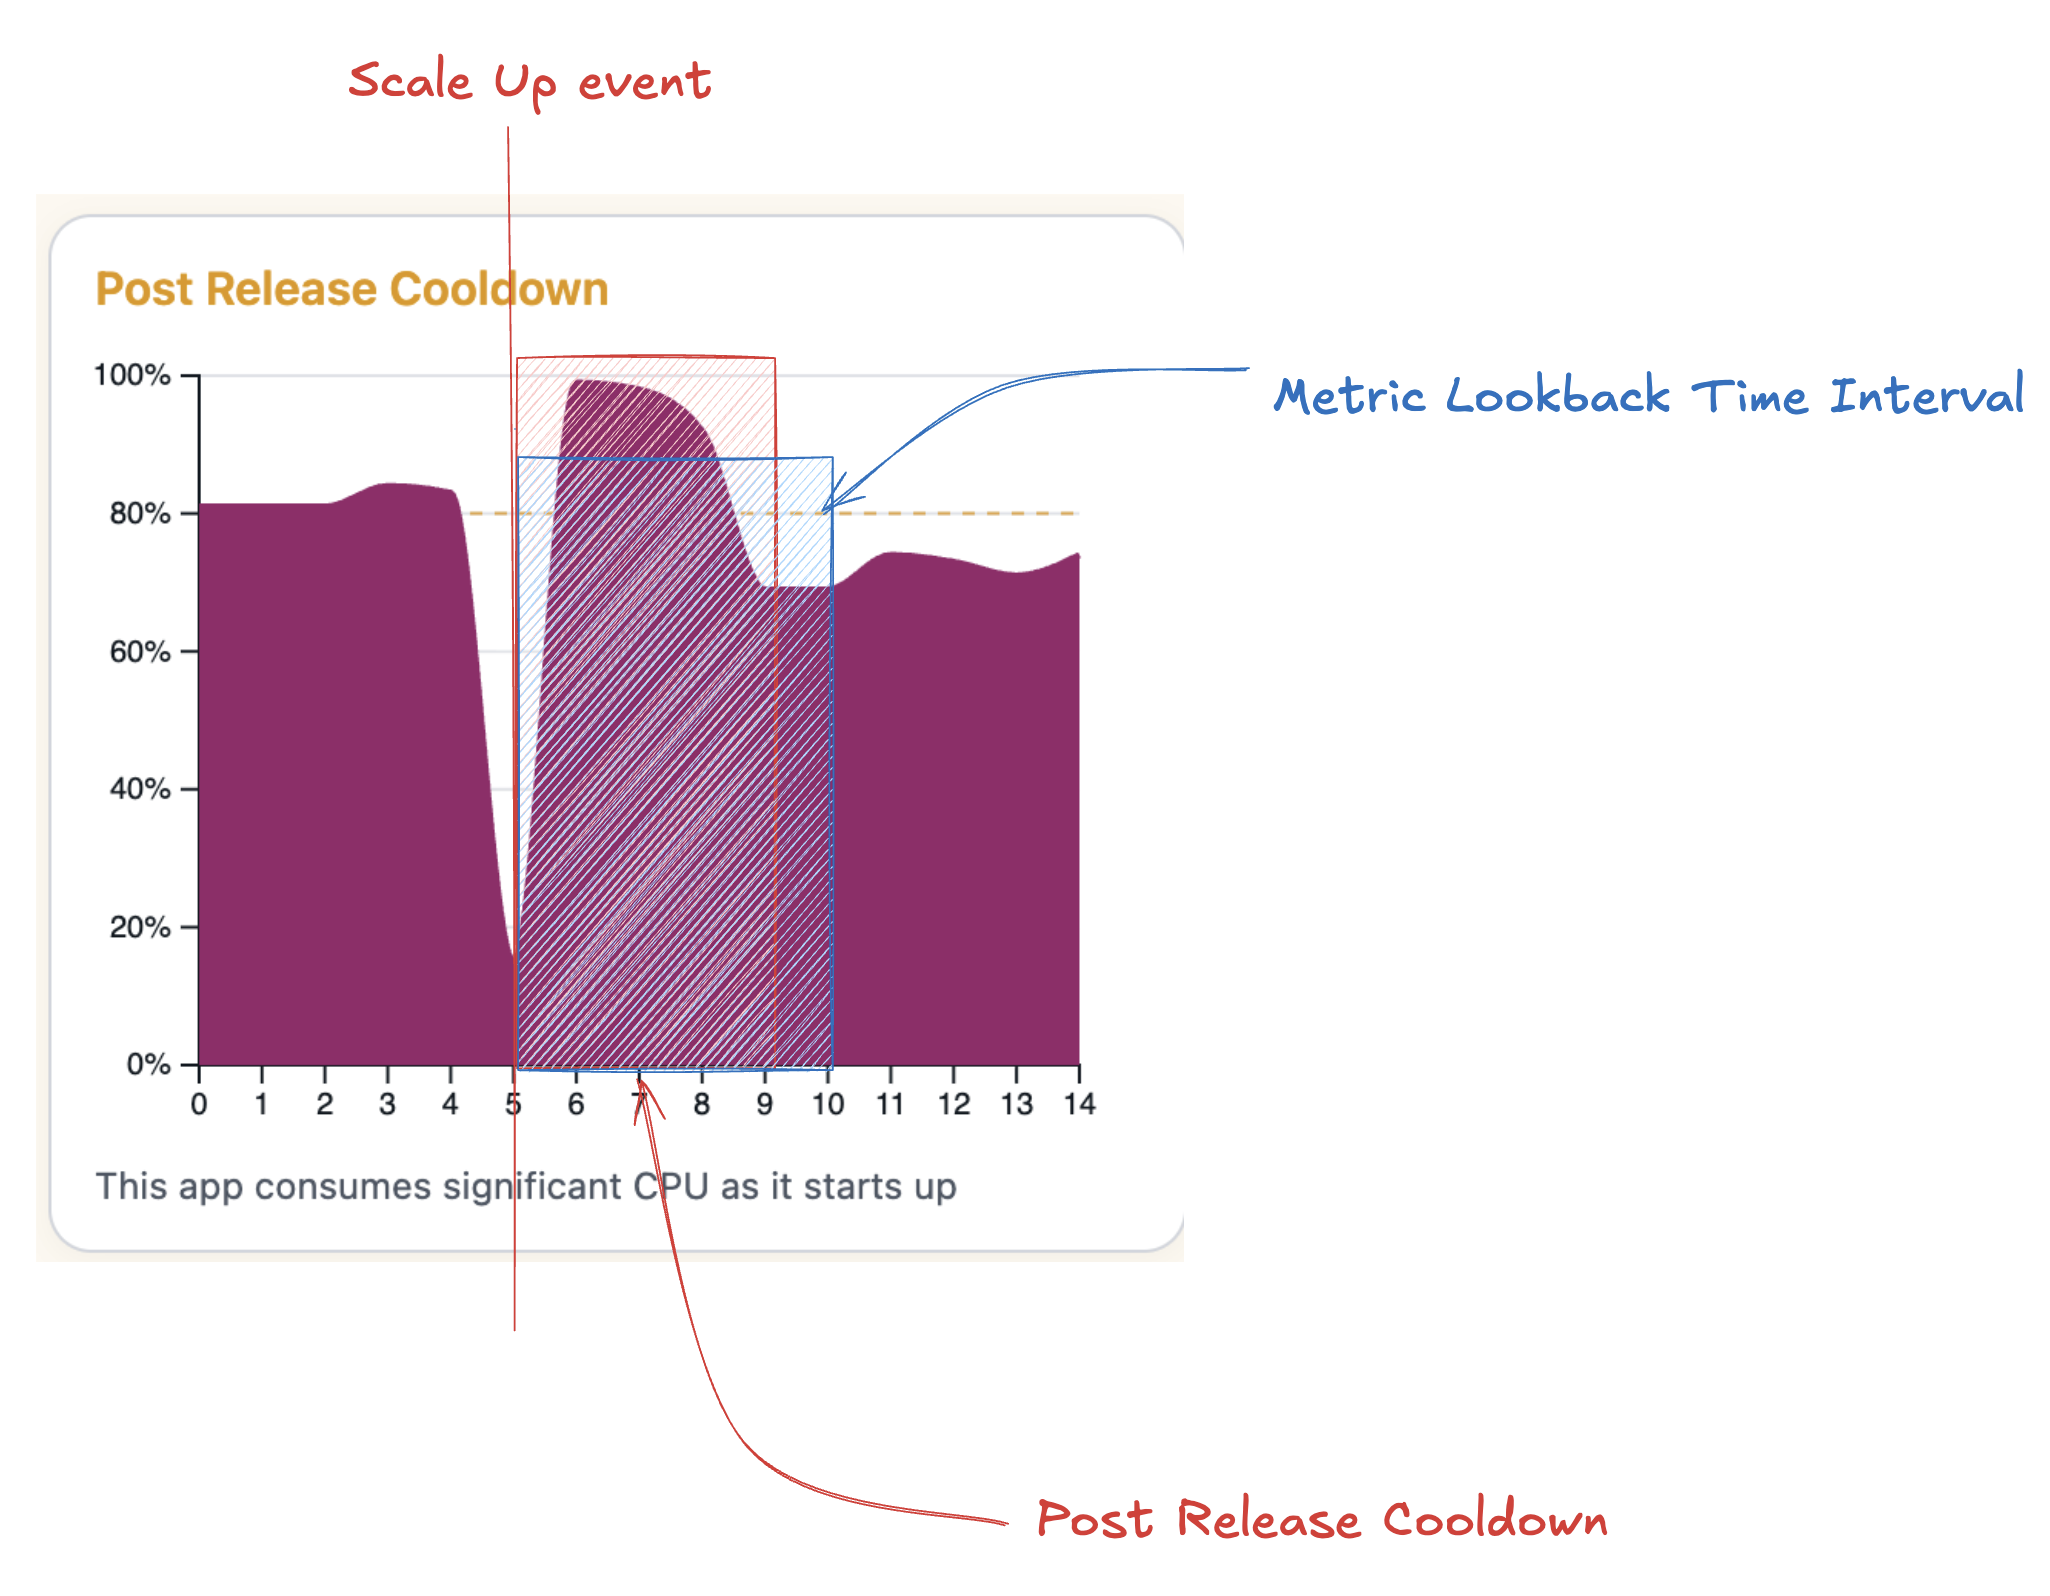
Let’s go through an example:
We have a service that exhibits periods of load and periods of near-zero use. It is a production service that is critical to us, so we want a high-availability setup, which means our minimum containers will be 2. Metrics for this service are as follows:
Since our low usage is 12%, the HAS default of 0.1 won’t work for us - we would never scale down. Let’s set it to 0.2 to be conservative
At 84% usage when under load, we’re near the limit but not quite topped out. Usually this would mean you need to validate whether this service would actually benefit from having more containers running. In this case, let’s say our monitoring tools have surfaced that request queueing gets high during these times. We could set our scale up threshold to 0.8, the default, or set it a bit lower if we want to be conservative.
With this, we can expect our service to scale up during periods of high load, up to the maximum number of containers if necessary. If we had set our max CPU limit to something like 0.9, the scaling up would be unlikely to trigger in this particular scenario. We may want to also consider enabling Restart Free Scaling to avoid the additional overhead of restarting all containers when scaling up during times of already high load.
With the metrics look-back period set to 10 minutes and our scale-up cooldown set to a minute(the default), we can expect our service to scale up by 1 container every 5 minutes as long as our load across all containers stays above 80%, until we reach the maximum containers we set in the configuration. Note the 5 minutes between each event - that is currently a hardcoded minimum cooldown.
Since we set a min CPU (scale down) threshold high enough to be above our containers minimal usage, we have guaranteed scale downs will occur. We could set our scale-down threshold higher if we want to be more aggressive about maximizing container utility.
Autoscaling Worker/Job processes
You can use horizontal autoscaling to scale your worker/job processes. However, you should consider some additional configurations:- Restart Free Scaling: When enabled, scale operations for modifying the number of running containers will not restart the other containers in the service. This is particularly useful for worker/job processes, as it allows you to scale up without interrupting work on the containers already processing jobs.
- Service Stop Timeout: When scaling down, the service stop timeout is respected. This is particularly useful for worker/job processes, since it allows time to either finish processing the current job, or put the job back on the queue for processing by another container. Note that containers are selected for removal based on the
APTIBLE_PROCESS_INDEXmetadata variable, selecting higher indices first, so if possible you should prefer to process long running jobs on containers with a lower index.